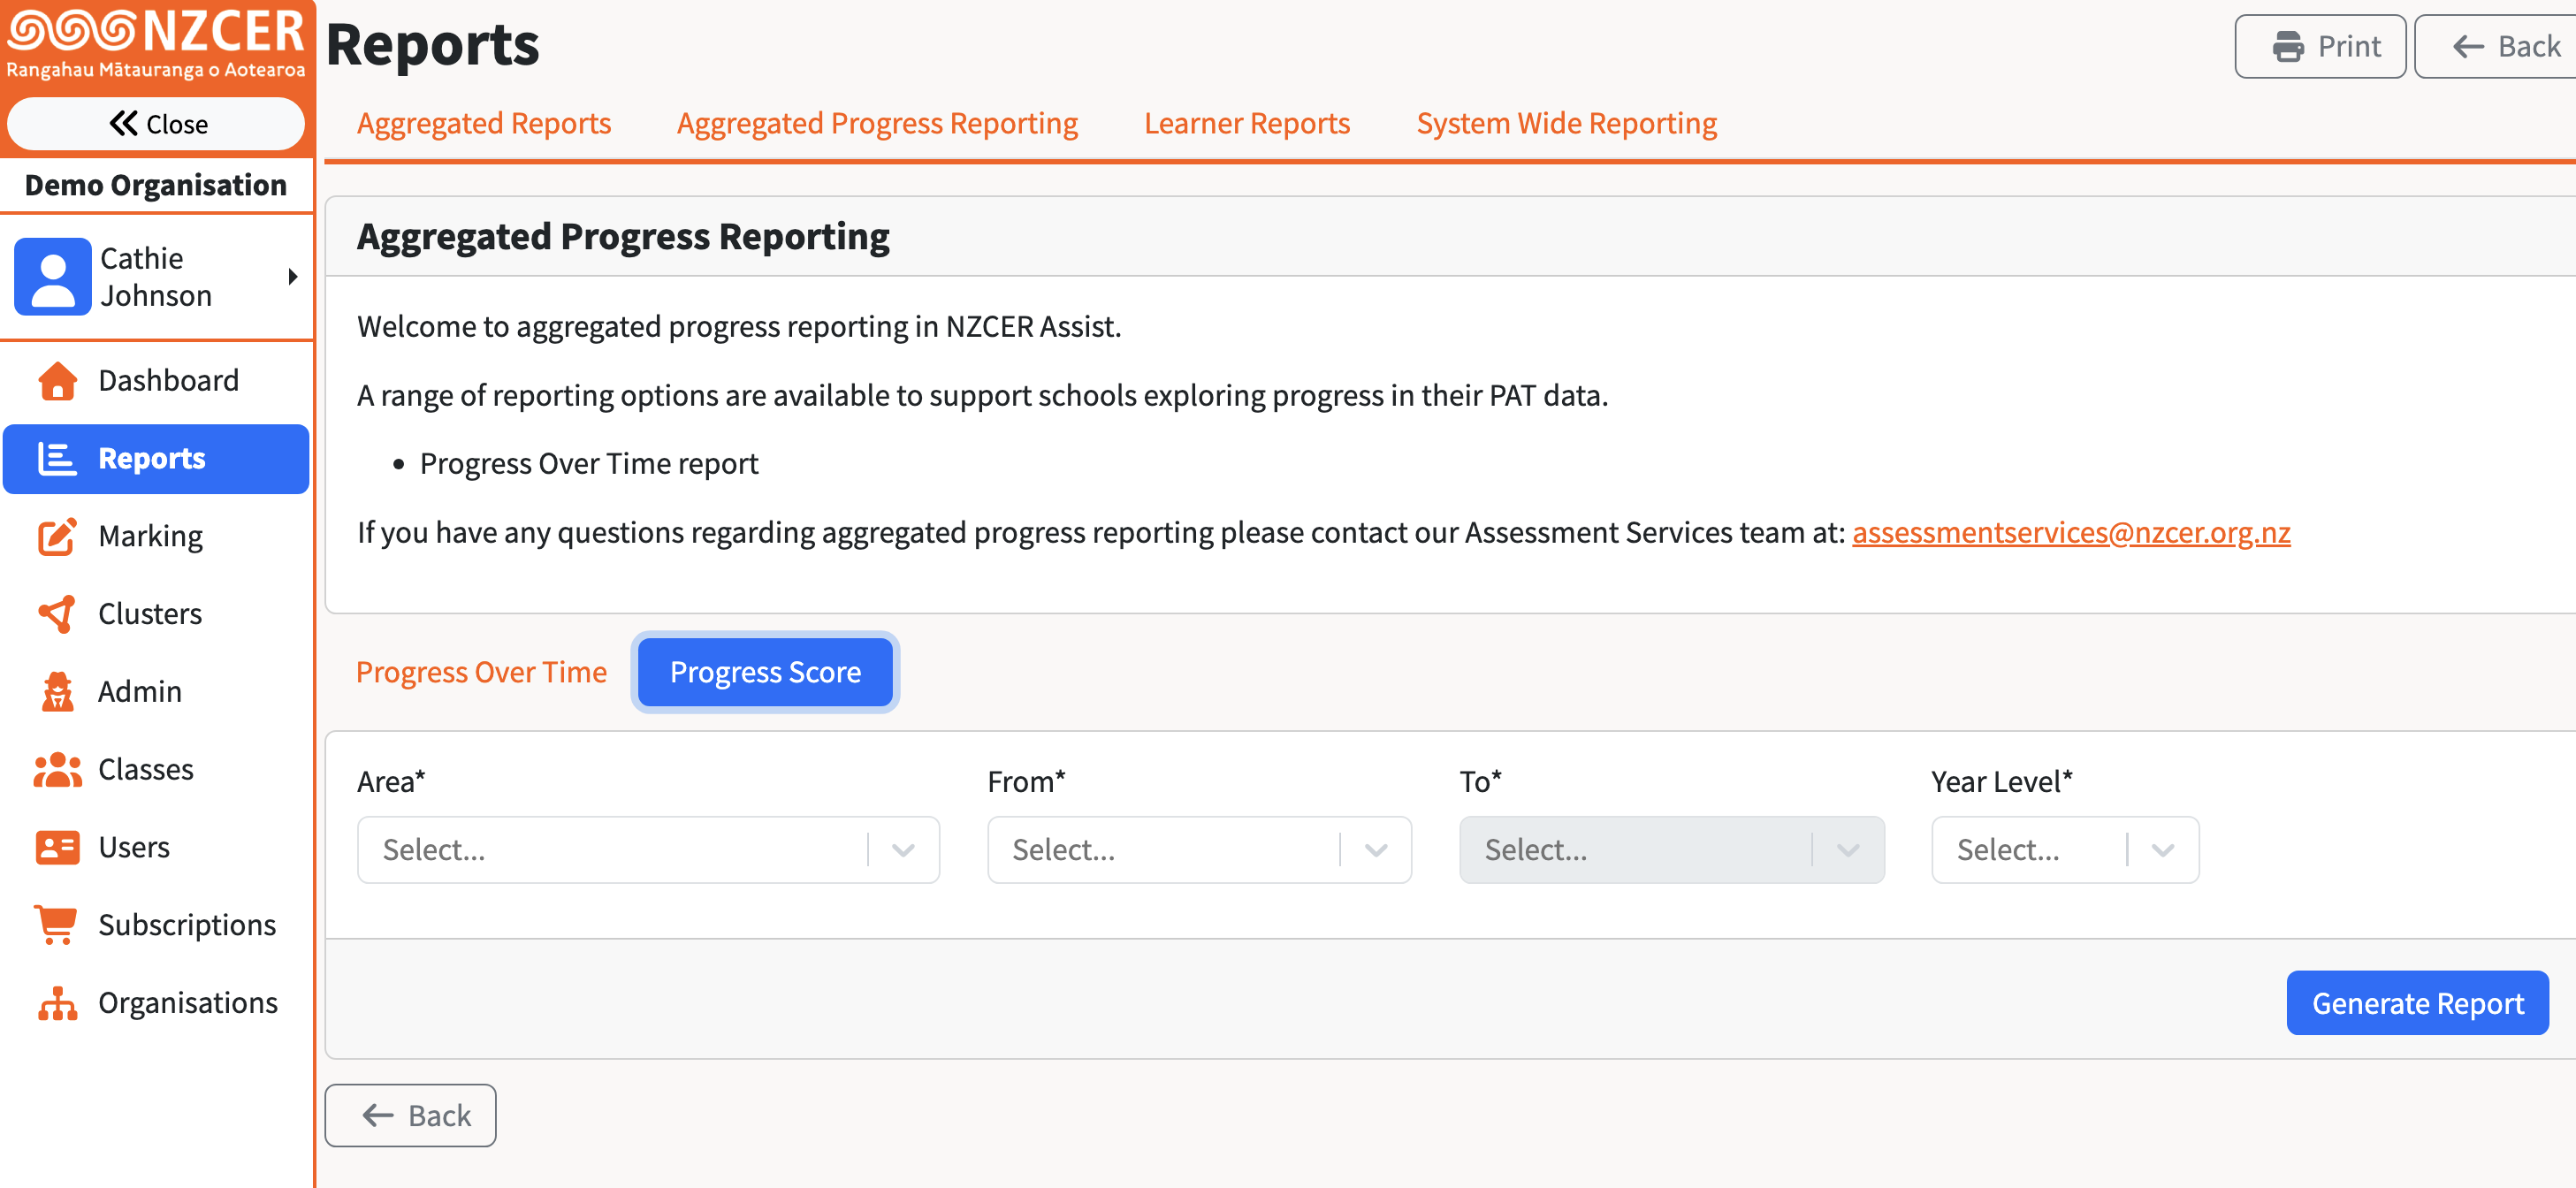
The Progress Report can be found under REPORTS (lefthand menu) then Aggregated Progress Reporting (top of page) then select PROGRESS SCORE. (see Below) Choose the two time points and current Year Level you want to review.
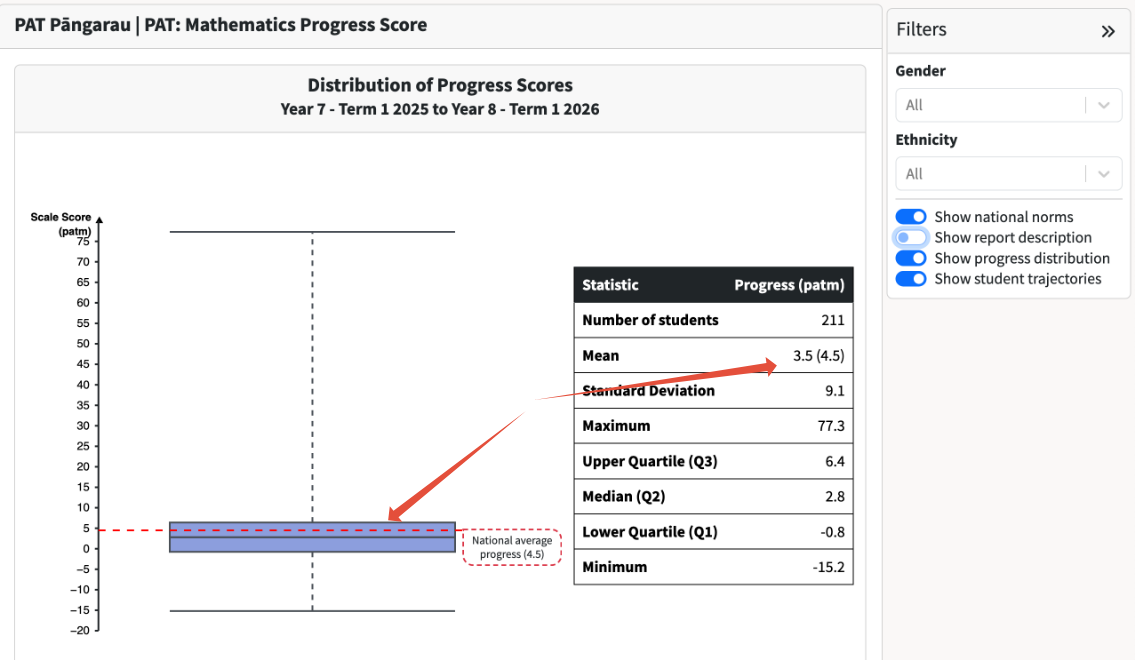
The Year Level boxplot will indicate the Year Level mean progress over the two time points and in brackets will be the national ref. progress benchmark over 12 months for comparison. Adjustments will need to be made if timepoints are less than 4 terms. This is a good place to use the fliters to review cohorts to refine your inquiry i.e gender or ethnicities. NB: the Nat Ref progress benchmark will remain unchanged - observe the cohort chosen's progress score to identify any anomalies.
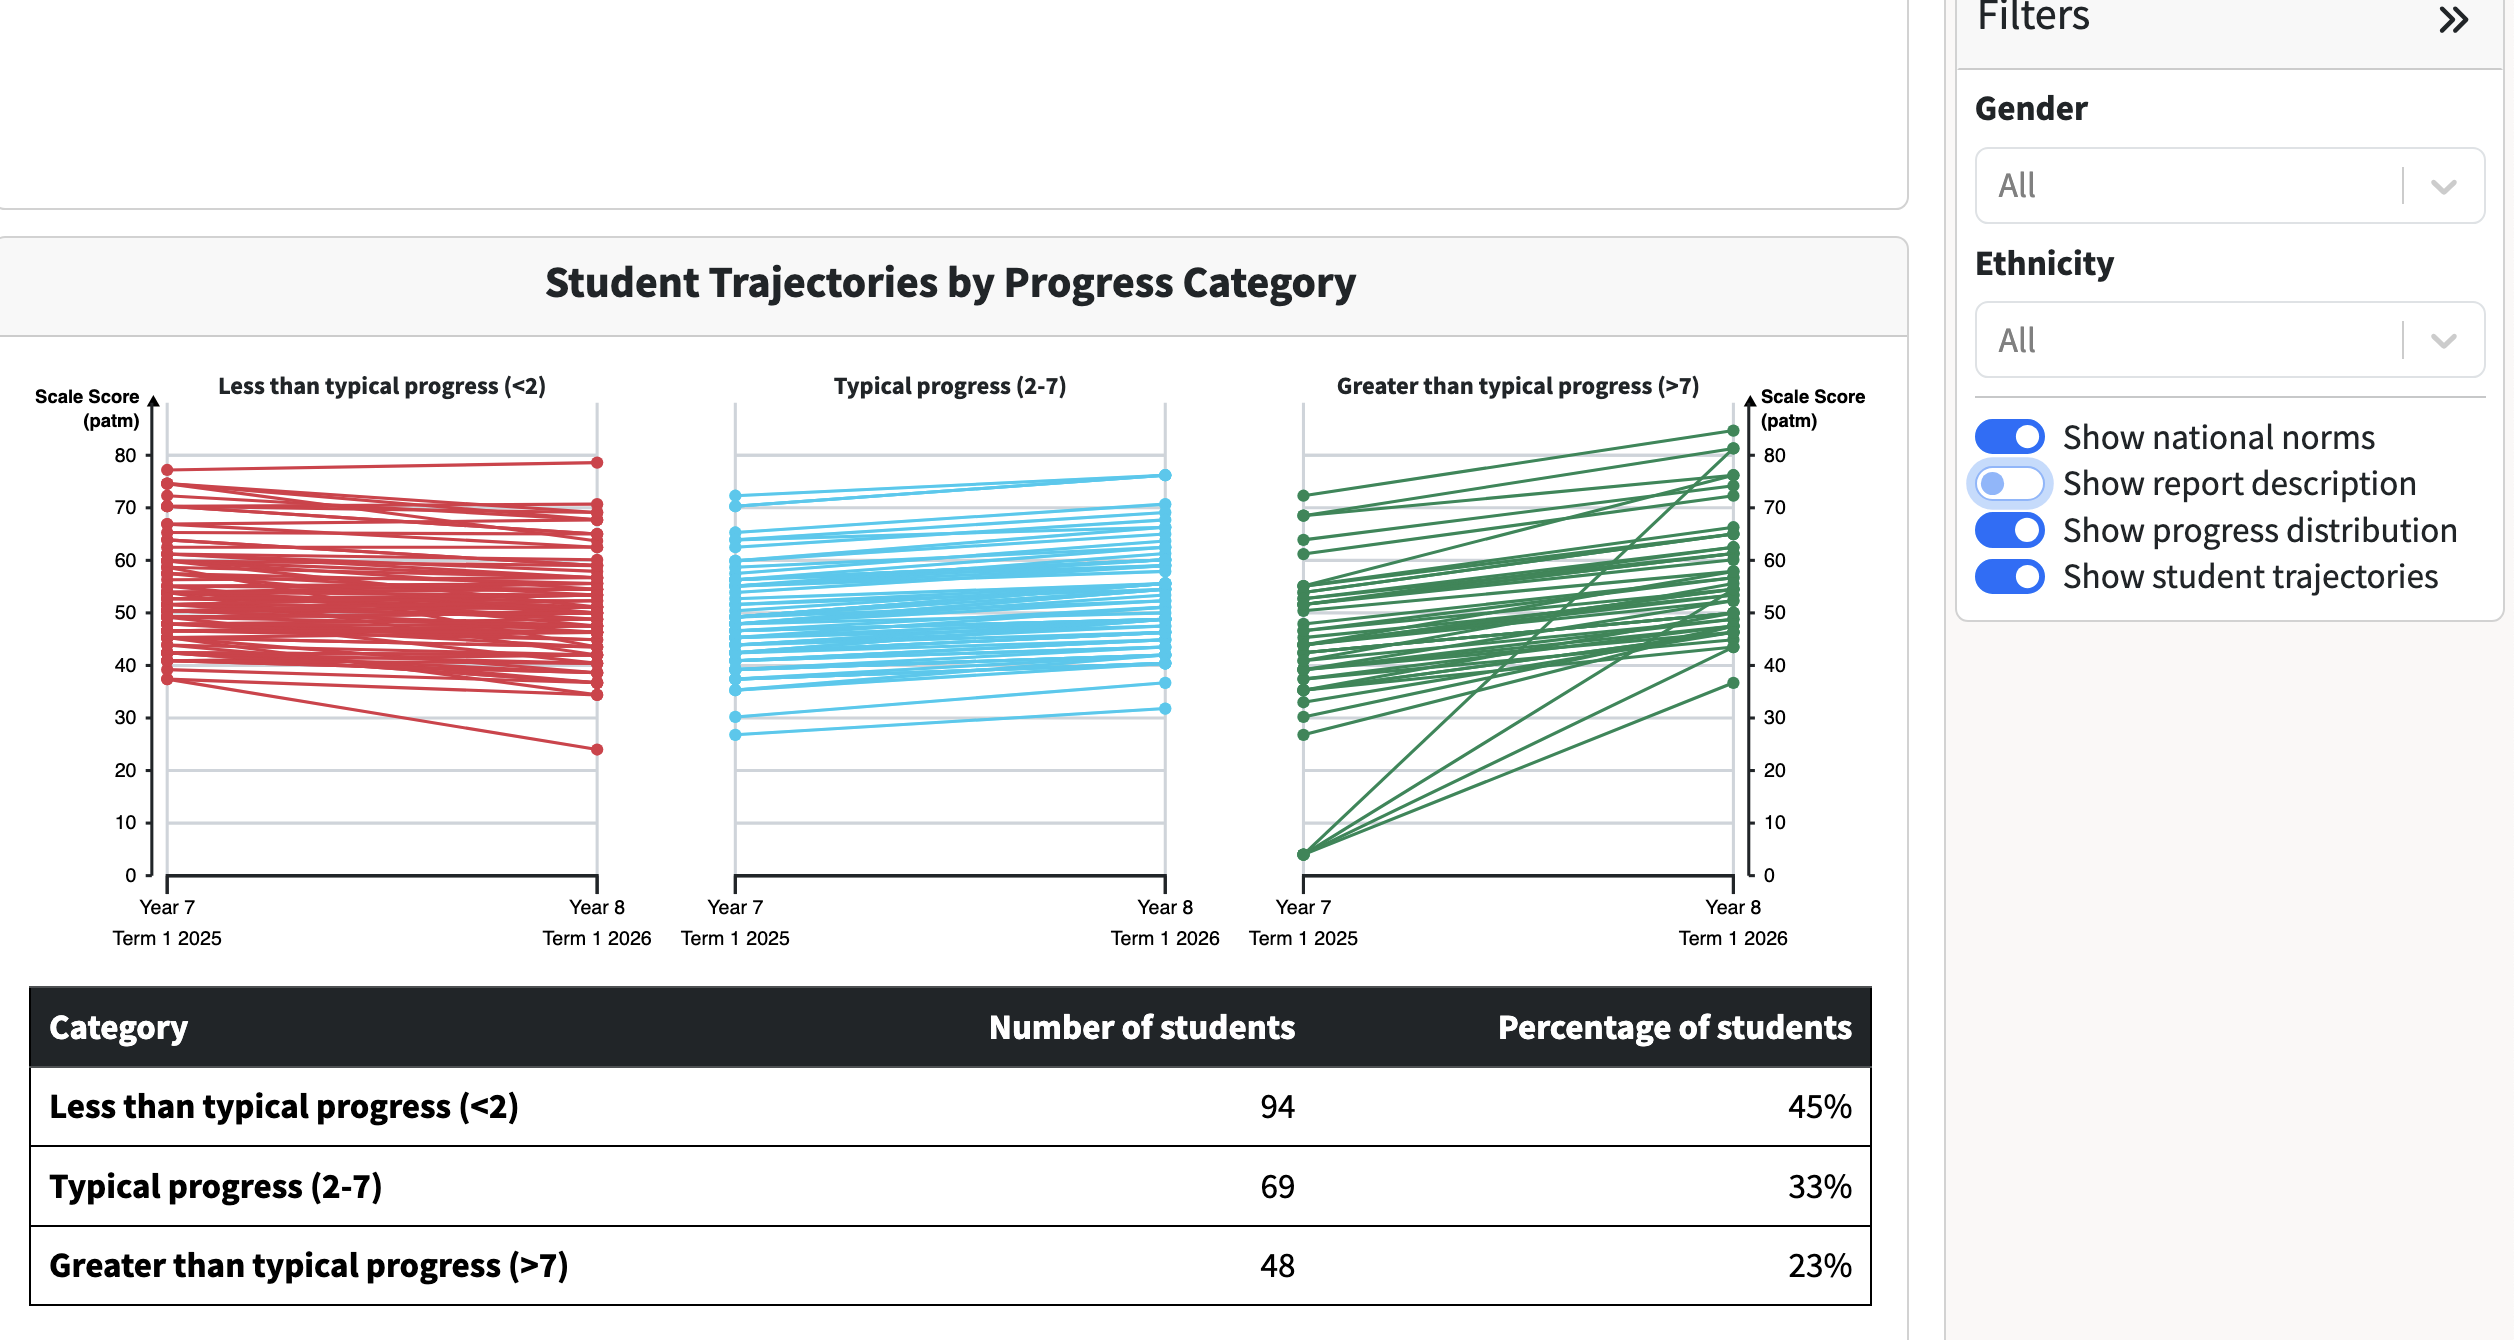
Scroll up to reveal the Student Trajectories by Progress Category graphs. Typical progress is based on the middle 50% of students nationally for the selected year level. Students in your cohort are grouped into three broad bands (less than typical, typical, and greater than typical) to help you interpret patterns in progress. Use the filters to track ialready identified cohorts of interest or simply work your way through gender and ethnicity to highlight strengths or cohorts in need.
NB: NZCER intends to add classes to the Filters and ākonga names to this report for deeper review of progress.
When reviewing the Trajectory graphs start with a strengths-based approach using Greater then typical progress - who is the teaching and learning working for and why? Use the filters to refine your search. Think about the following:
- What is the average scale position for this cohort - use Term 1 or Term 4 whichever is the closest?
- Look at ākonga scale positions - are they students above average, below average, or both, that have shown acceleration? How and why - discuss.
- Use the gender and ethnic filters to refine your search - any patterns?
- Can you think of any programmes or interventions that might have had an impact on these learners? Can they be expanded to include others who need to accelerate?
Typical progress
- What is the average scale position for this cohort - use Term 1 or Term 4 whichever is the closest?
- Look at ākonga scale positions - are they students above average, below average, or both, that have shown acceleration?
- Use the gender and ethnic filters to refine your search - any patterns? Any conclusions about what has to happen next?
Less than typical progress
- What is the average scale position for this cohort - use Term 1 or Term 4 whichever is the closest?
- Look at ākonga scale positions - are they students above average, below average, or both, that have shown acceleration?
- Use the gender and ethnic filters to refine your search - any patterns? Any conclusions about what has to happen next?
- Ask 'why' ākonga have made limited progress anf think broadly to ensure next steps are relevant
- Kaiako facility with maths concept progressions?
- Student engagement and belief in themselves as mathematicians?
- Kaiako-ākonga relationships - are they relationships for learning - partnership, feedback/feedforward, interesting/relevant learning contexts
Next steps:
You could:
- Move to the Progress Over Time report and review the progress shifts of students at different points on the boxplot.
- Ask kaiako to review their class List Report for both test timepoints and identify students who have made minimal or no shift - ask for their thoughts on why. This is a good process to go through to build ownership and facility with the scale score and scale shift and to spend some time in self-reflection about their teaching and the learning that occured. Shifting kaoako thinking requires starting with what they THINK happened.
- Review the Item Reports to identify concepts/items where the percentage correct did not make shift.
- Each teacher reviews the Individual Reports of target students to try to understand why student progress scores are so variable
NB: If a student sat a test that was too hard or too easy for them this may produce anomalies in their scale progress. These ākonga may be better served by using the Maths Adaptive test.